Intracellular caspase activities vs Annexin-V

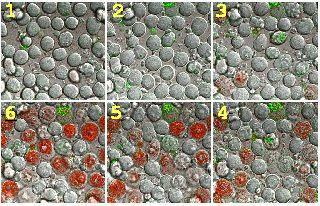 Time-lapsed confocal microscopic images of
mouse T-cells undergoing apoptosis. A series of images was taken- the order of images is
indicated by the number in the top left corner. The red fluorescence is derived from
PhiPhiLux® cleaved by CPP32 (caspase3 and caspase3-like proteases) and the
green fluorescence is from Annexin-V-FITC binding to phosphatidyl serine in the outer
leaflet of the plasma membrane.
Time-lapsed confocal microscopic images of
mouse T-cells undergoing apoptosis. A series of images was taken- the order of images is
indicated by the number in the top left corner. The red fluorescence is derived from
PhiPhiLux® cleaved by CPP32 (caspase3 and caspase3-like proteases) and the
green fluorescence is from Annexin-V-FITC binding to phosphatidyl serine in the outer
leaflet of the plasma membrane.

Intracellular caspase activities
vs mitochondrial stain
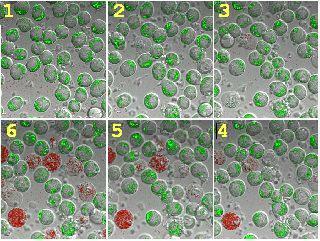 Time-lapsed confocal microscopic images of
mouse T-cells undergoing apoptosis: a series of images was taken- the order of images is
indicated in the top left corner. The green fluorescence is from DiOC6, a probe of
membrane potential of healthy mitochondria. The red fluorescence is derived from PhiPhiLux®
cleaved by caspase-3. Note: all cells are healthy with active mitochondria (image #1);
with time (images 2-6) potentials across mitochondrial membranes are lost and the CPP32
activity increases.
Time-lapsed confocal microscopic images of
mouse T-cells undergoing apoptosis: a series of images was taken- the order of images is
indicated in the top left corner. The green fluorescence is from DiOC6, a probe of
membrane potential of healthy mitochondria. The red fluorescence is derived from PhiPhiLux®
cleaved by caspase-3. Note: all cells are healthy with active mitochondria (image #1);
with time (images 2-6) potentials across mitochondrial membranes are lost and the CPP32
activity increases.


